|
|
|
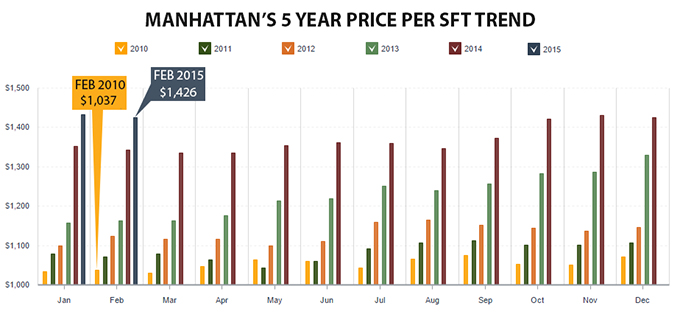
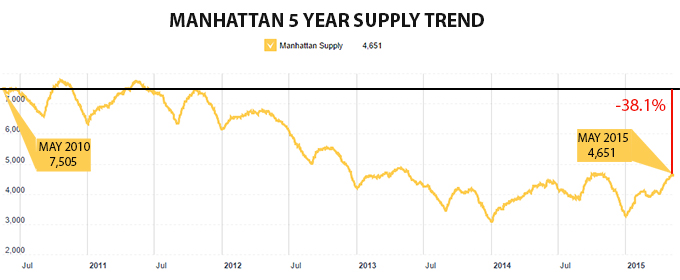
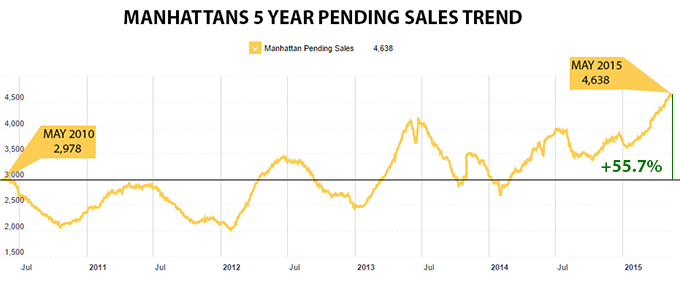
Our friends at UrbanDigs did a wonderful job showing the 5 Year price trend in Manhattan. We have To look at the bigger picture here and absorb what the Manhattan market did over the past 5 years. Its truly remarkable when you look at it in this light. The main metrics we will be focusing on are: 1. Manhattan Price Per Sft Trends since 2010 2. Manhattan Supply Trends since 2010 3. Manhattan Pending Sales Trends since 2010 So we will keep it simple by looking at pace of supply, pace of demand and the level of price performance over the past 5 years. First, lets take a look at Manhattan price performance since May 2010 (price action) – here is the chart. Quite telling. Since May 2010, Manhattan Price Per Sft Trend is UP 37.5% Second, lets take a look at Manhattan Supply since May 2010 – here is the chart. The inventory shortage everyone is talking about is quite evident by this chart. Supply is highly seasonal, with surges between Jan and May, and sharp declines in July & August as well as December. Since May 2010, Manhattan Supply is DOWN a whopping 38.1% Third, lets take a look at Manhattan Pending Sales since May 2010 – here is the chart. A clear look at how the pace of demand for Manhattan property has accelerated. The latest surge is something you can feel if your are on the front lines of this marketplace. Price right, and your property should sell within a month. The data speaks for itself and shows how current conditions, with leverage strongly in favor of sell side, has been in the works for some time! I have been a broker in the Manhattan markets since 2005 and the past 18 months has been the longest stretch I can recall where seller’s had such a sustained advantage. Buyers should expect conditions to be “competitive” for another month or so before the summer slowdown hits. Those buyers that are waiting to participate until things cool down will be doing so at the sacrifice of new supply as July & August are typically 2 of the slowest months for new listings to hit the market throughout the calendar year; behind only December. Something to keep in mind. Cheers. To read the full article at Urbandigs.com, click here
|
|


