Manhattan Real Estate Insights
Our friends at Urban Digs published a thought-provoking article about the Real Estate Market in New York City as we come to a close for 2015.
The wave that hit stock markets & credit markets in July/Aug seems to have passed and volatility in general has plunged – remember, it takes a while for this to impact Manhattan buyers and it also takes a while for them to forget the “risks” that existed only a few months ago! So, while equity markets may have rebounded nicely, Manhattan real estate contract activity is still seasonally sluggish. Lets look at the October numbers and discuss.
You have to look at recent data in terms of price point because right now Manhattan sector performance is highly segmented depending on what price tier you are in. In short, the super luxury market corrected & came down to earth real fast dragging with it the other higher price points. As you get to the lower price points, the impact was less and less.
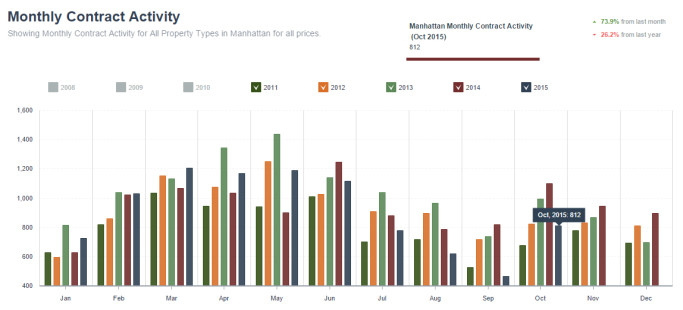
Manhattan Contract Activity (Deal Volume) for the past 5 Years:

Notice how low August & September & October deal volume has been compared to the same month in past years. There is a reason we look at Monthly deal volume this way, because Manhattan real estate is seasonal and as such you should compare the current period with the same period a year prior to filter out seasonality. September deal volume was a disaster, in my opinion a direct result of the global equity selloff and the rising level of uncertainty that comes with it. October rebounded from a brutal September but as you can see from the chart it still came in at seasonally low levels.
Conclusion –> Contract activity continues to be seasonally sluggish as buyers remain cautious. The euphoric & complacent bidding that took place in the early months of 2015 is gone. Buyers are more cost conscious and adjusting bids accordingly or going to the sidelines until confidence rises. This is causing a gap between bid & ask resulting in seasonally “weak” deal volume. We are yet to know how much of a price shift down has taken place because we need to wait for deals signed in Aug, Sep & Oct to close and file in from ACRIS. The shift down will certainly be more severe the higher the price point you go! Sellers need to listen to the current market data and adjust pricing strategies accordingly because of conflicting data lags & sources — ie, the real-time market has slowed relative to earlier 2015 peak, but the lagging comps & sale data is yet to reflect this down shift in price action. Real estate professionals must manage sell side client expectations properly on this dynamic.
October Contract Activity

The conclusions become more clear when you break down contract action this way — 74% of the deals signed in the month of October were in the $2M and under market.
Finally, lets take a look at the ratio of Supply vs Pending Sales (listings Active & For Sale vs listings In-Contract, pending closing) – this ratio gives us an indication if market leverage favors buyers or favors sellers.
The higher the ratio the more the leverage is shifting towards buyers – the lower the ratio the more the leverage is shifting in favor of sell side.

We at UD think somewhere between 2.0 and 3.0 is a normal market. Push that ratio a bit higher for $10M+ market obviously, but this view shows just how separated the Luxury market is right now compared to lower price points.
Why Buyers Should Be Happy
Buyers should be happy that today’s market doesn’t have the attributes that defined the earlier peak and that they finally got a bit of a break. How much of a break is yet to be determined as sale prices for deals signed today take months to file in. But it seems like these peak period attributes have faded away:
– 50% of deals trading at or above the asking price
– a median days on market of 40
– fierce buy side competition for limited supply resulting in bidding wars,
– being asked to remove financing contingency to have a chance, etc.
Sellers enjoyed progressively rising leverage shifts in their favor that seemed to peak in early 2015. I keep saying that because the lagging sales data shows this peaking in June & July. Earlier this year we were managing expectations that 8 out 10 bids we submit for clients are for multiple offer situations and that getting a private 1-on-1 negotiation wasn’t realistic outside of overpriced, lingering inventory. Today, buyers have noticeably more leverage albeit in a market where inventory is yet to substantially rise. Thats the downside here, there is still a lack of quality product in the baseline $2M and under price points. The $10M+ market is of course behaving differently and is its own animal at this point.
With credit markets stabilizing and equity markets rebounding, serious buyers should enjoy the leverage advantage that was non existent since the 2011-2012 days. I would not expect to get a 20% discount though. As I will mention at the end of this piece, I feel like any shift lower in price action was minor and under 10% – the higher end excluded.
Why Sellers Shouldn’t Be Upset
Sellers must understand where we came from and just how much the Manhattan market has reflated since the depths of hell in early 2009. Look at the Manhattan Price Per SFT (PPSF) chart below for a very broad summary of price action since the trough in 2009.

Manhattan PPSF baseline is +40% over the course of a 6+ year reflation that saw a total recoup of losses and brought price action to higher levels than the prior 2007 peak. The high end sector saw incredible returns over this time period. So what if the market turns a bit lower after a run like this! The shift occurring now is normal considering where we came from and is a healthy breather for longer term sustainable growth. Its possible the current market continues to operate at this lower level relative to the recent peak for a while.
Sell-side expectations must be managed especially when the real-time market data(slowing) & the lagging sales data (peaking) tells conflicting stories as it is doing today. There is nothing worse than a seller who wants to sell and is ready to sell but who has an unrealistic expectation on current value due to a lack of understanding today’s market trends. This is NOT the time to look at a recent comp and add 5% due to the very fact that today’s market is weaker than it was 3-6 months ago.
I would guess that Manhattan experienced a baseline 7% to 10% adjustment down from peak sales figures that were booked over the summer months – natural market dynamics at work. We will have to wait until Feb-March for this to be confirmed and the UD Price Per SFT chart (lagging 60 days) is what will show it.